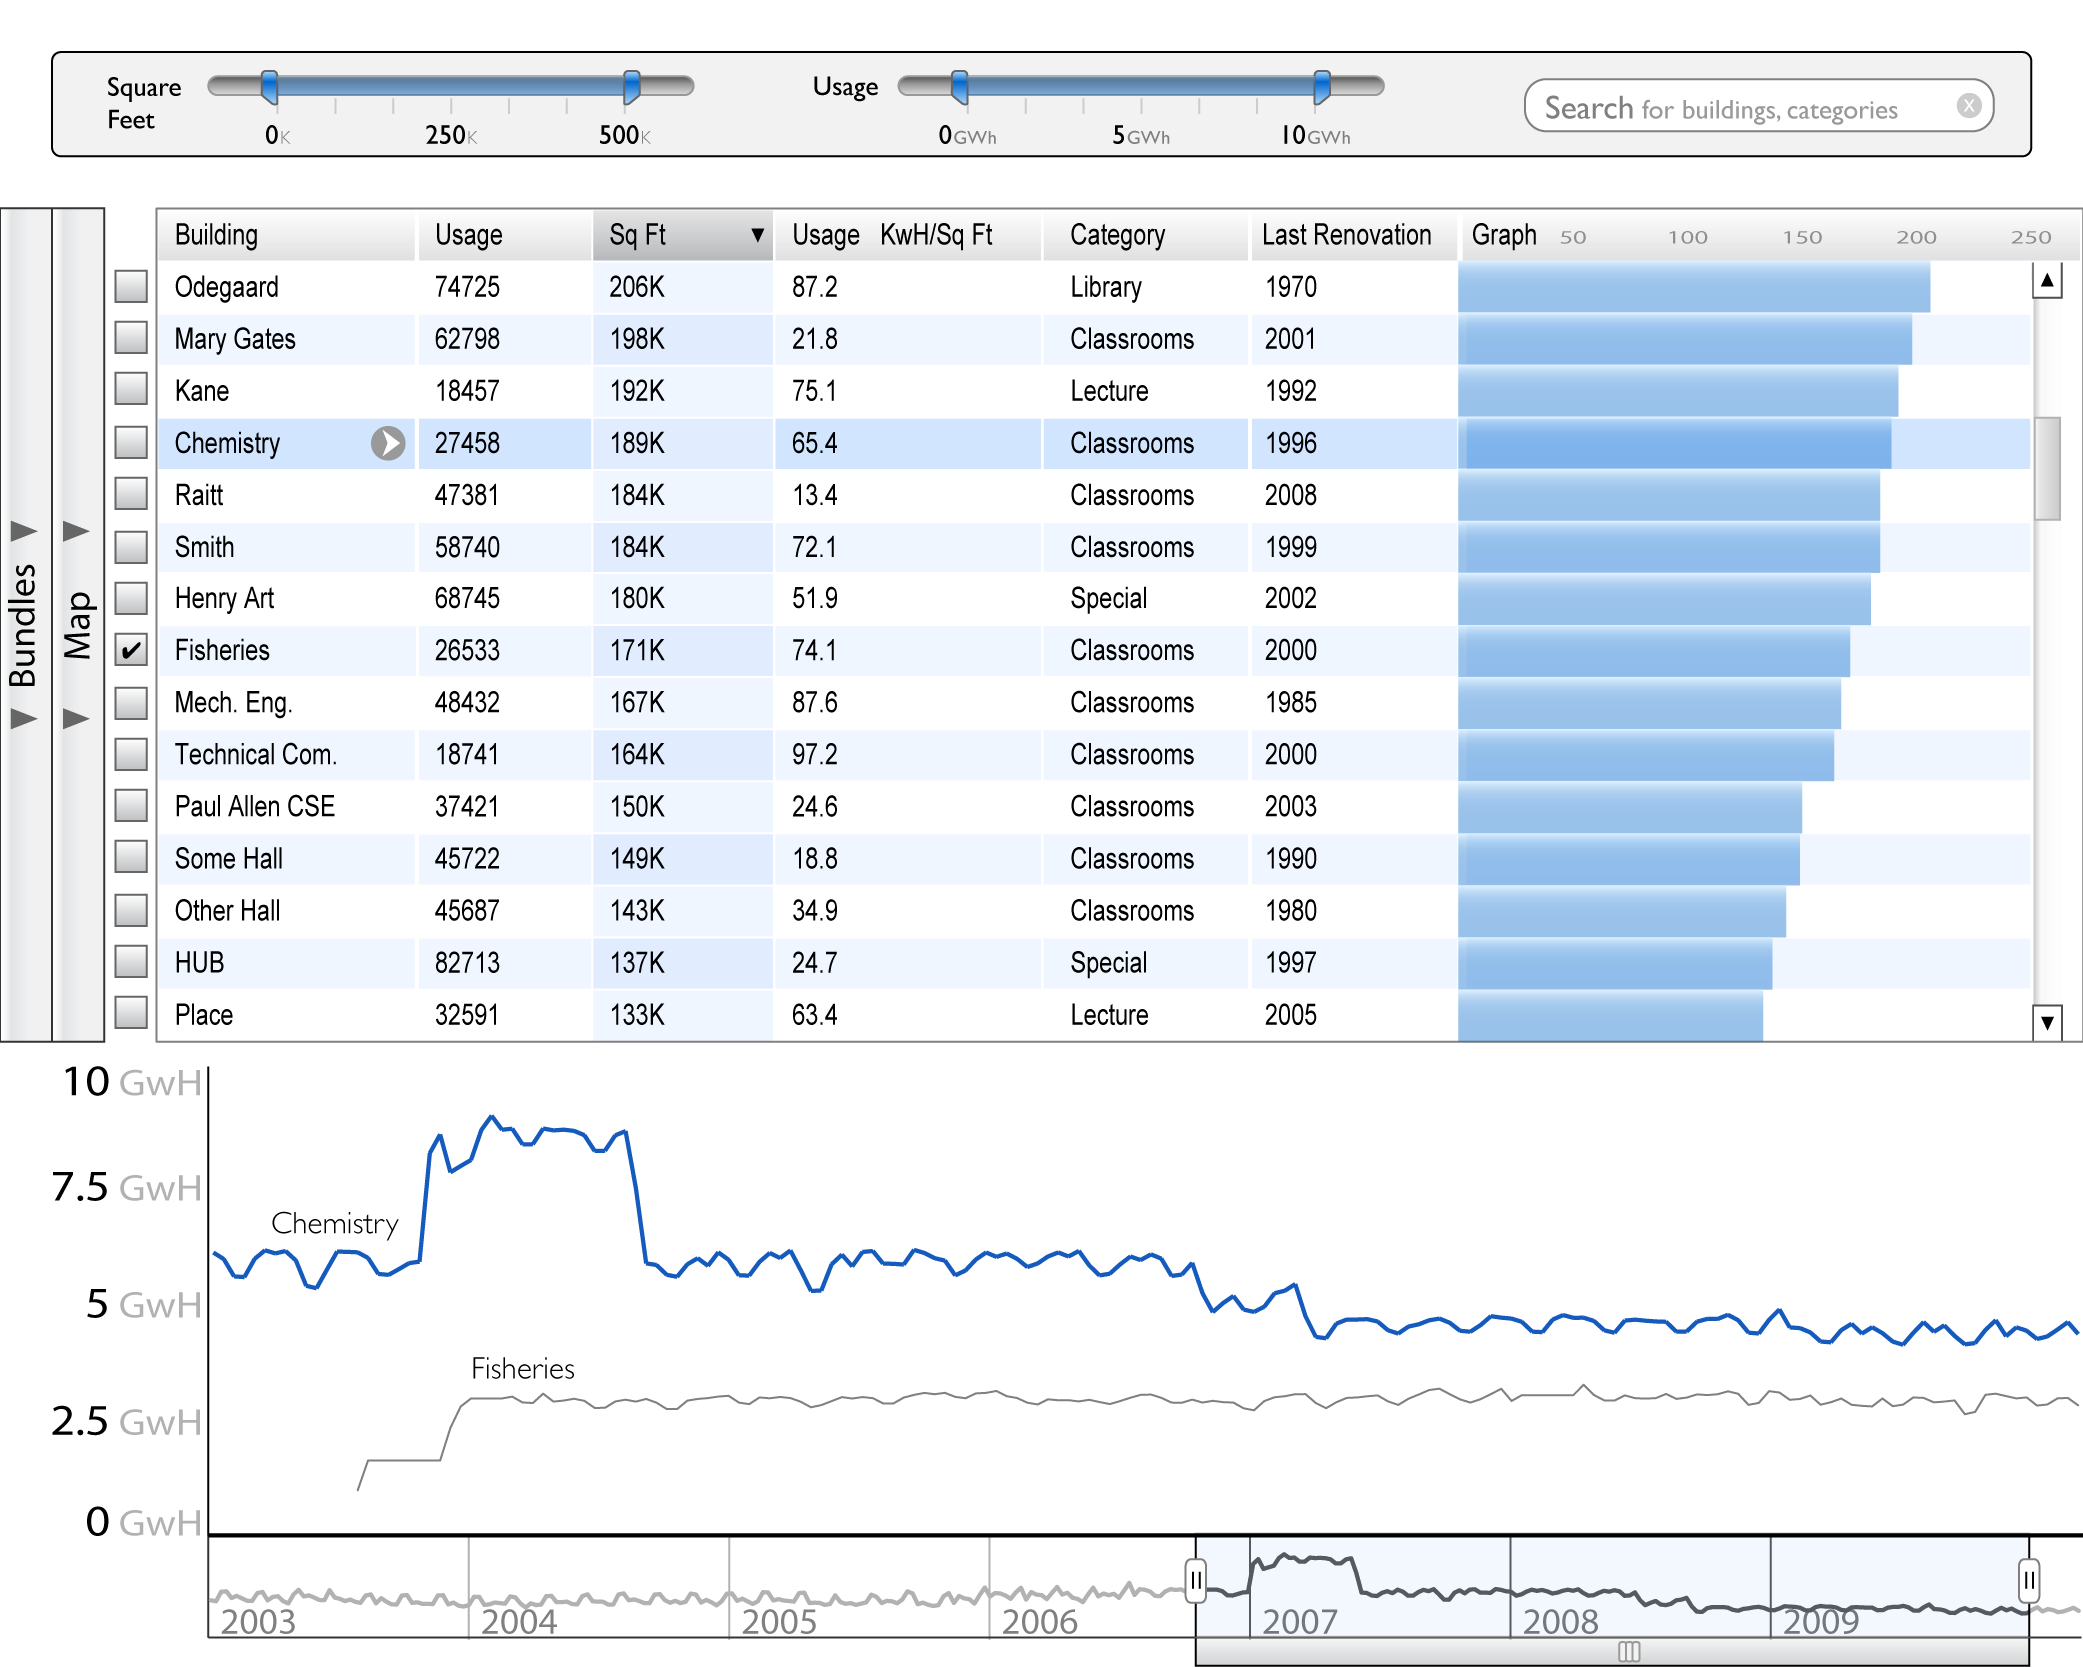
High Fidelity Mockup
There are three types of data at my disposal: amount used, timestamp of usage, and corresponding building. Approximately 400 buildings have been keeping track of electricity since 2003, with roughly 96 readings per building per day. The project, deceptively simple with only three main types of data, becomes quite complex when there are several million energy readings in the database.
With the assistance of professors David Hendry and Axel Roesler, I was tasked with finding a way to display energy use, and moreover, where electricity is being wasted.
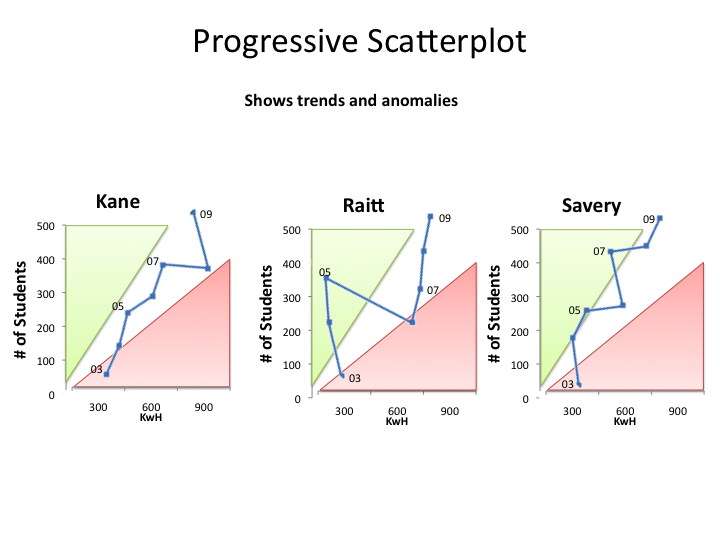
Progressive Scatterplot
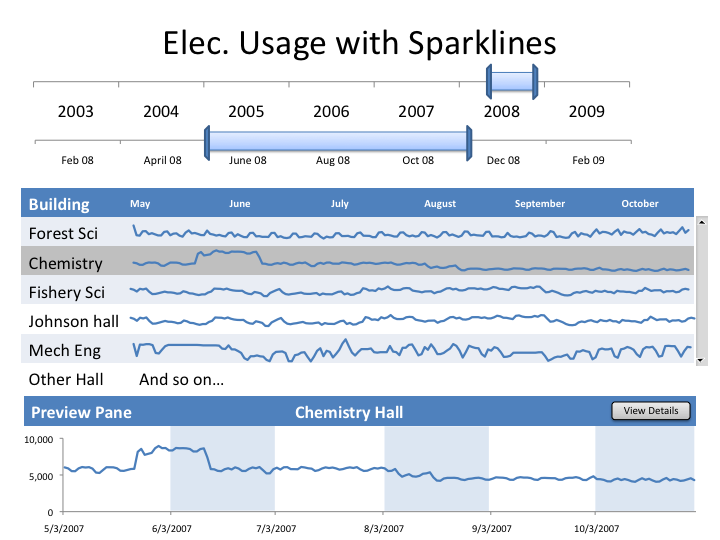
Elec. Usage with Sparklines
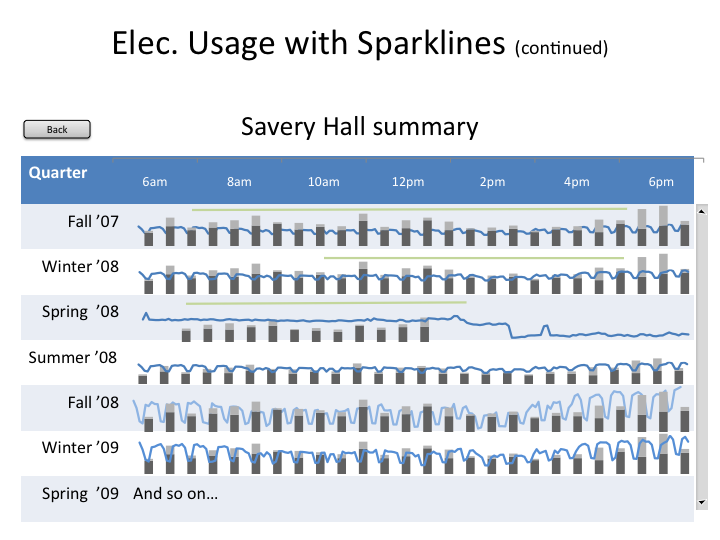
Elec. Usage with Sparklines (cont.)
Further into the quarter, I was able to meet with Jeremy Park, a Power Systems Engineer at UW, in order to better direct my project towards clients like himself. This meeting aided in deciding which visualizations to pursue. Finally, the low-fidelity mockup was converted into a higher-fidelity mockup.
| David Hendry — Professor, Ph.D. in Information Science, Information School |
Axel Roesler — Professor, Ph.D. in Cognitive Systems Engineering, Art dept. |
Marilyn Ostergren — Ph.D. candidate in Information Science, Information School |